Measuring 2.0: The Web 2.0 Dynamic Instrument (part 5 of 5)

In the last 4 parts of this series I tried to present my aggregated essence of what I think are the main Web 2.0 Factors (W2F) which influence/drive the development of the Web:

  • Part 1: Decreased costs for content-inventory and -distribution, aka Longtail
  • Part 2: Successful, tested, and freely available Features & Innovations
  • Part 3: Connecting the like-minded people to build stable, social structures
  • Part 4: End of Control for any content due to worlds largest built copymachine ever (Internet)
  • Part 5: Combining the most influential factors driving new Business Opportunities
Busi´ness
Evolution prefers the most efficient/optimized solution to a problem (you can optimize it anytime = optimization-margin). Solutions which take the most powerful driving forces of the web and build themselves on it, are best candidates to also profit of this dynamic with a sustainable business.

My ultimate goal was to identify these W2F and to create some kind of benchmarking tool which would make it easy to check ideas, features, services and existing solutions against them. As a result of evaluating against four driving W2F a process would reveal the level by which something can profit of the existing dynamic of change. Those ideas/services/features which would like to ride the wave of webdevelopment/change should take these factors into account to kick off a successful business. Therefore the four W2F which were in detail described in several blogposts here, can be logically combined into some kind of Web 2.0 Dynamic Instrument (W2DI) which I called the „thetameter“:
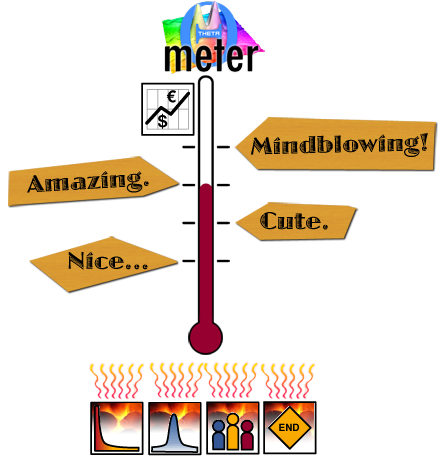
Energy in a System
thetameter the W2DI Benchmarking Tool (Please click to zoom graphics)
Graphic was updated/changed on 28th of Oct 2008

The instrument is capable of displaying the possible business-impact of things beeing powered by the four W2F. So the last part of how to measure „2.0“ is the combined business potential which results from the various Web 2.0 Dynamic Factors (W2F) beeing added up to one value of energy (like e.g. the heat).

Why do I blog this? I think that this instrument will ease the process of evaluating new ideas. Sure the metaphor of this graphic (thetameter) looks like some childish, colorful if not ridiculously easy thing, but it should be taken into account that this benchmark is based on four very diverse criterias, which make up the final value of an evaluated idea. The difficult part is not to add some values, it is the evaluation of each criteria from all kind of perspectives to be able to compare things with each other. I will soon demonstrate the exemplary use of how the instrument works and how one can easily check how much potential some service/idea or feature really has.
Measuring 2.0: End-of-Control´ness (part 4 of 5)

The first three key-factors i.e. driving forces behind „2.0“ (this series does NOT cover web2.0 it covers 2.0ness in general) were already part of this series (Part 1, Part 2, Part 3). Now comes factor 4 beeing the so called end of control. Here I am only a thieve of Gerd Leonhard’s point of view, who has analyzed the changes in the music sector very closely. For me it boils down to control beeing systemtically more and more impossible. Even if you might be able to manage it technically e.g. to remove a youtube-video, it will pop up in manifold ways also somewhere else. nothing that was once leaked over to youtube ever diminished again from the digital space because the internet inherently works through making copies. Every webpage you surf is exactly that: A Copy. And copies once sent out cannot be controlled anymore…

End-of-Control´ness
End-of-Control´ness seems to be one criteria of a kind. It simply means, that people want your stuff in their place and that hindering people doing so will let visitors/customers even hardcore fans move elsewhere. Inconvenience just doesn’t scale (No DRM; No walled gardens.)

What does this mean in detail? Especially what does it mean for beeing successful in anticipating this factor? How can I profit from knowing about the „End of Control“ beeing such a huge driving force? The first question one might ask is „What do I want to control and why?“. Often it is the content people want to be in control of. This may be some picture, audio, video, pdf-document or even some page with text on it. Keeping these things under control means keeping them walled. Nobody can connect to them as long as he is not a member of the „walled garden society“, and even then it is often impossible. You cannot point/refer/link to it, you cannot cite/mashup/rip it, you cannot share it or show it to others.

But exactly that is what makes up the current web: links which do not get broken by a wall. Citations of an image which catches the eye immediately to make it a visual link/cue. Sharing of stuff to connect the like minded. If I can choose to either cite from a page with an image on it or to not beeing able to cite a page with an image, because it is under some kinde of control, I will decide for the page without control. Content out of control will sooner or later outpace certain kind of content under control. Content under control becomes obsolete, because nobody cares any longer if nobody can see it, refer to it, and cite it.

Content out of control will spread like a virus without any barrier and gain attention, while content under control will only serve a minor part of the internet-community, the „walled garden society“. Expressing it differently: If Martin Luther would have kept his revolutionary, religious theses under control, nobody would have ever heard about it. It would have been irrelevant and may never have gained enough traction. But he put his manifest out of control, knowing that this way he would gain attention and something I would like to coin „thinktime“. People spend their limited thinktime on information which can easily travel, not on stuff that is protected and though made difficult to reach.

Only if the effort to overcome protection of content is really worth the content (which you often cannot check beforehand), users will be willing to work through e.g. registration-procedures or clumsy payment-processes. End of Control content results in more thinktime for people to be spent. Giving away your content results in mor thinktime beeing spent on it. Along with this comes attention for the context the original content is embedded into.

Ian Rogers from Yahoo nailed this with the sentence „Inconvenience doesn’t scale.“ A similar point of view is shared by Matt Mason in his book The pirates dilemma. Long story made short: Control, i.e. Copy-Control is no option for an infrastructure like the internet which is the largest built copymachine ever.

Just the opposite is true, one of the most successful concepts of 2.0-powered sites is content-let-free. Offering content via plugin- or embed-code is one very successful way to reduce control. Youtube offers embed-code for videos, flickr offers embed-code for pictures and picture-collections, lastfm.com offers embed-code for music, slideshare offers embed-code for slideshows. Many other services give their content away through explicit API’s and RSS-Feeds. Giving away control means winning a lot of thinktime and beeing able to participate in one of the most influential factors powering 2.0.

Sources of Inspiration:

Killerapp „OpenTrace“ aus Japan auf TC50

opentrace_logo1.pngAuf der TechCrunch50 Conference 2008 wurde soeben eine Idee vorgestellt, die brilliant ist.

Ein Portal namens OpenSpaceOpenTrace.org, das die Zutaten von jedem Produkt anzeigt und daraus den Environmental Impact also die Umweltbeeinträchtigung bei der Produktion darstellt und transparent macht für den Konsumenten.

Herr Knüver schreibt für Handelsblatt ins Blog und twittert fleissig:

Open Trace liest den Barcode eines Produktes und gibt dann die Umweltwirkung des Produktes an. Dabei geht es nicht nur um den Transport dieser Ware, sondern auch so weit, dass sich die einzelnen Bestandteile (Salz, Wasser, Hefe, etc. bei einem Brot) CO2-technisch aufschlüsseln lässt. Das sieht wahnsinnig cool aus, ist aber in dieser Form nicht wirklich ein Geschäftsmodell. Für Bio-Hersteller, die offener über ihre Zuliefer sind, könnte das etwas sein.

Folgendes Video zeigt mehr:

Von dieser Anwendung – die den Anspruch hat das Wikipedia für Produktprozesse zu werden – werden wir noch einiges hören, da bin ich mir sehr sicher. Eine wirklich tolle Idee! Warum bin ich da nicht drauf gekommen? Mein Papa (Förster) wäre stolz gewesen auf mich. :-D OpenTrace wird auch auf der Earth2Tech Conference präsent sein, wie ich grade lese.

logo_dotspots.pnglogo_livehits.pnglogo_kronomy.pnglogo_yammer.png

Nightly Update
blahblah.pngDie BlahBlahBlahgirls sind ein Startup, das das Zeug hat eines der bissigsten Videoblogs zu werden. In bester Manier von Southpark (auch optisch) wird über Prominenz und anderen Gossip hergezogen. Dagegen war/ist Blond am Freitag (gibt’s das noch?) Kindergarten aber die haben auch kein Productplacement benutzt ausser für Sekt und Salzstangen glaub ich.

Update 4.12.2024

Nun nur noch rauchende Reste davon auf YT.

Meet…“The Blah Girls!“ BlahBlahBlah is an interactive, animated, irreverent Web series, told through the perspective of the Blah Girls – Tiffany, Krystle and Britney and the hottest of of all Hot Stewart. They keep you up to date on the latest in celebrity gossip, fashion, relationships and life as it happens. http://www.blahgirls.com

Created by Ashton Kutcher & Jason Tusman

Hier gibts alles zu lesen:

TechCrunch50 News Aggregator

Why do I blog this? Ich bin wirklich selten so beeindruckt worden und dafür gebührt den beiden Japanern mein ganzer Respekt. Andere Favoriten auf der TC50 waren für mich „LiveHit„, „dotspots„, „kronomy“ und „yammer“ das twitter für Enterprise 2.0 done right!