In the last 4 parts of this series I tried to present my aggregated essence of what I think are the main Web 2.0 Factors (W2F) which influence/drive the development of the Web:
- Part 1: Decreased costs for content-inventory and -distribution, aka Longtail
- Part 2: Successful, tested, and freely available Features & Innovations
- Part 3: Connecting the like-minded people to build stable, social structures
- Part 4: End of Control for any content due to worlds largest built copymachine ever (Internet)
- Part 5: Combining the most influential factors driving new Business Opportunities
Evolution prefers the most efficient/optimized solution to a problem (you can optimize it anytime = optimization-margin). Solutions which take the most powerful driving forces of the web and build themselves on it, are best candidates to also profit of this dynamic with a sustainable business.
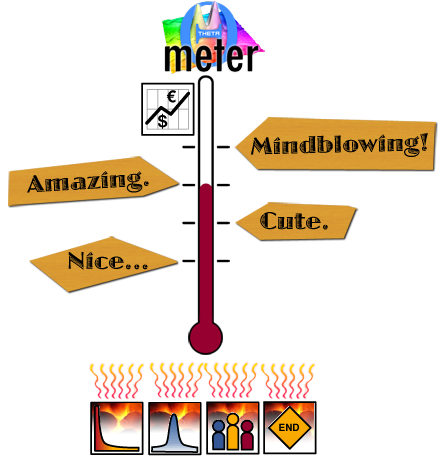
My ultimate goal was to identify these W2F and to create some kind of benchmarking tool which would make it easy to check ideas, features, services and existing solutions against them. As a result of evaluating against four driving W2F a process would reveal the level by which something can profit of the existing dynamic of change. Those ideas/services/features which would like to ride the wave of webdevelopment/change should take these factors into account to kick off a successful business. Therefore the four W2F which were in detail described in several blogposts here, can be logically combined into some kind of Web 2.0 Dynamic Instrument (W2DI) which I called the „thetameter“:

thetameter the W2DI Benchmarking Tool (Please click to zoom graphics)
Graphic was updated/changed on 28th of Oct 2008
The instrument is capable of displaying the possible business-impact of things beeing powered by the four W2F. So the last part of how to measure „2.0“ is the combined business potential which results from the various Web 2.0 Dynamic Factors (W2F) beeing added up to one value of energy (like e.g. the heat).
Why do I blog this? I think that this instrument will ease the process of evaluating new ideas. Sure the metaphor of this graphic (thetameter) looks like some childish, colorful if not ridiculously easy thing, but it should be taken into account that this benchmark is based on four very diverse criterias, which make up the final value of an evaluated idea. The difficult part is not to add some values, it is the evaluation of each criteria from all kind of perspectives to be able to compare things with each other. I will soon demonstrate the exemplary use of how the instrument works and how one can easily check how much potential some service/idea or feature really has.

Ein Gedanke zu „Measuring 2.0: The Web 2.0 Dynamic Instrument (part 5 of 5)“